
Crypto
CZ hopes in 5 years people stop talking about crypto and just use it
Cointelegraph
Solana's price is currently consolidating above $82 after failing to maintain levels above $85, indicating a potential bullish bias.
Key support levels for Solana include $82.50 from a bullish trend line and $80, below which the price could extend losses.
Solana's price experienced a downside correction similar to Bitcoin and Ethereum, dipping below $84 and entering a short-term bearish zone.

Solana's price has corrected below $85 and is currently consolidating above $82, indicating a potential for further gains. A bullish trend line is forming, but a dip below $80 could extend losses.
Solana failed to stay above $85 and corrected some gains. SOL price is now consolidating and might aim for another increase above $85.
Solana price failed to stay above $85 and started a downside correction, like Bitcoin and Ethereum. SOL dipped below $84 and $83.50 to enter a short-term bearish zone.
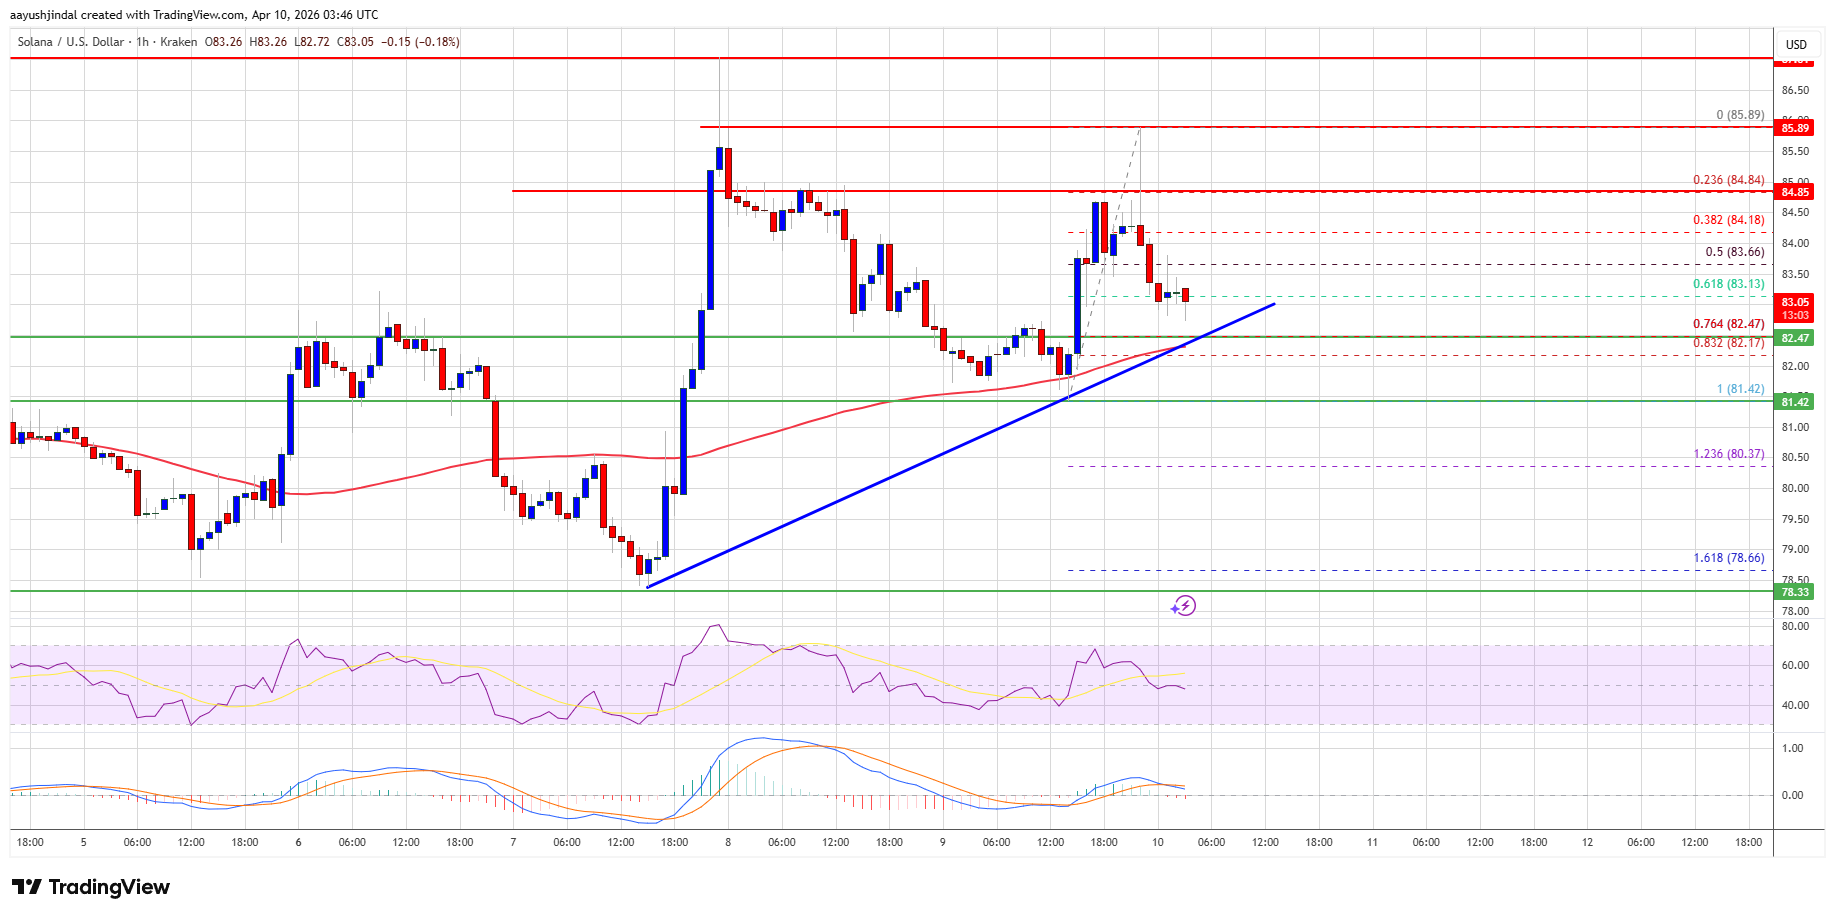
There was a move below the 50% Fib retracement level of the upward wave from the $81.42 swing low to the $85.89 high. The price even tested the $83 support. Besides, there is a bullish trend line forming with support at $82.50 on the hourly chart of the SOL/USD pair.
Source: SOLUSD on TradingView.com
Solana is now trading above $83 and the 100-hourly simple moving average. On the upside, the price is facing resistance near the $84 level. The next major resistance is near the $85 level. The main resistance could be $88. A successful close above the $88 resistance zone could set the pace for another steady increase. The next key resistance is $95. Any more gains might send the price toward the $100 level.
If SOL fails to rise above the $85 resistance, it could start another decline. Initial support on the downside is near the $82.5 zone, the trend line, and the 76.4% Fib retracement level of the upward wave from the $81.42 swing low to the $85.89 high. The first major support is near the $81.40 level.
A break below the $81.40 level might send the price toward the $80 support zone. If there is a close below the $80 support, the price could decline toward the $76.50 support in the near term.
Technical Indicators
Hourly MACD – The MACD for SOL/USD is losing pace in the bullish zone.
Hourly Hours RSI (Relative Strength Index) – The RSI for SOL/USD is below the 50 level.
Major Support Levels – $82.50 and $80.00.
Major Resistance Levels – $85.00 and $88.00.
Share this article


See every story in Crypto — including breaking news and analysis.